4. Visualizing Facial Expressions#
written by Eshin Jolly
In this tutorial we’ll explore plotting in Py-Feat using functions from the feat.plotting module along with plotting methods using the Fex data class. You can try it out interactively in Google Collab: ![]()
To help visualize facial expressions in a standardized way, Py-Feat includes a pre-trained partial-least-squares (PLS) model that can map between an array of AU intensities (between 0-N) and facial landmark coordinates. Just pass in a numpy array of AU intensities to the plot_face() function to visualize the resulting facial expression. In general we find that a 4 by 5 aspect ratio seems to work best when plotting faces (default in plot_face()).
For more details on how this visualization model was trained and how to train your own see this advanced tutorial.
# Uncomment the line below and run this only if you're using Google Collab
# !pip install -q py-feat
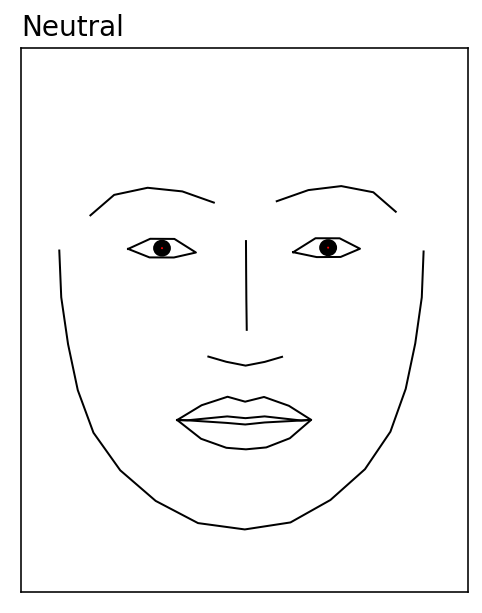
4.1 Plotting a neutral (default) face#
To plot a neutral facial expression just pass in an array of 0s to plot_face() which always returns a matplotlib axis handle:
from feat.plotting import plot_face
import numpy as np

# 20 dimensional vector of AU intensities
# AUs ordered as:
# 1, 2, 4, 5, 6, 7, 9, 11, 12, 14, 15, 17, 20, 23, 24, 25, 26, 28, 43
neutral = np.zeros(20)

ax = plot_face(au=neutral, title='Neutral')
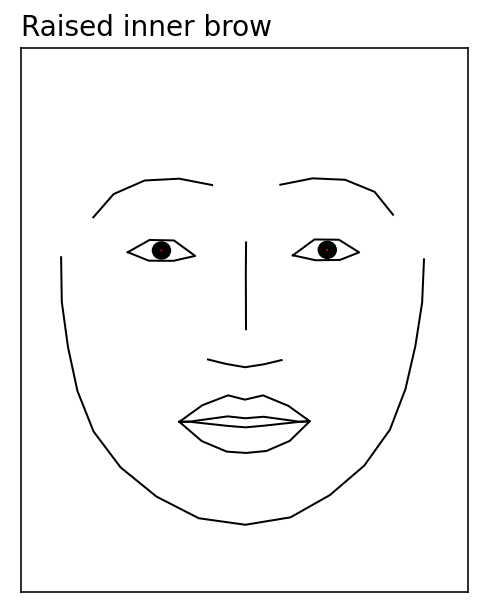
4.2 Plotting AU activations#
Plotting facial expressions from AU activity is just as a simple. Below we increase the intensity of AU1 (inner brow raiser) to 3 before passing it to plot_face().
In general based on how our visualization model works, we don’t recommend AU intensities greater than 3 as more exaggerated intensities can produce distorted facial expressions
raised_inner_brow = np.zeros(20)
# Increase AU1 intensity: Inner brow raiser
raised_inner_brow[0] = 3

_ = plot_face(au=raised_inner_brow, title="Raised inner brow")
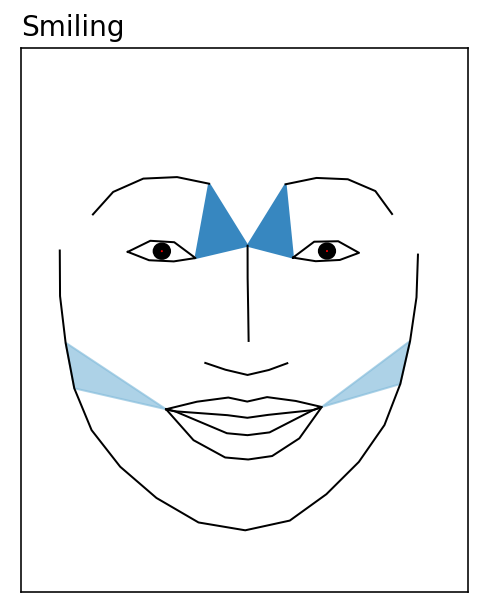
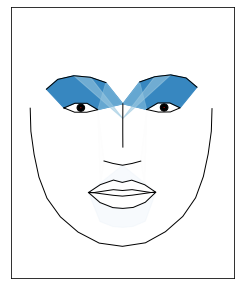
Adding muscle heatmaps to the plot#
We can also visualize how AU intensity affects the underyling facial muscle movement by passing in a dictionary of facial muscle names and colors (or the value 'heatmap') to plot_face().
Below we activate 2 AUs and use the key 'all' with the value 'heatmap' to overlay muscle movement intensities affected by these specific AUs:
# Activate AUs
smiling = np.array([3, 0, 0, 0, 0, 0, 0, 0, 2, 0, 0, 0, 0, 0, 0, 0, 0, 0, 0, 0])

# Overlay muscles
muscles = {'all': 'heatmap'}

_ = plot_face(au = smiling, muscles = muscles, title='Smiling')
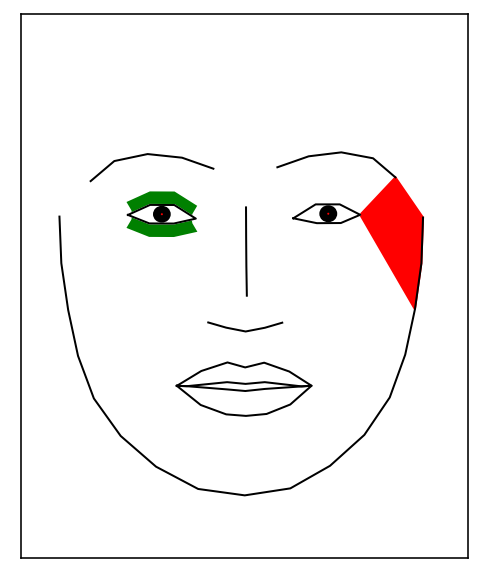
But it’s also possibile to arbitrarily highlight any facial muscle by setting it to a color instead. This ignores the AU intensity and useful for highlighting specific facial muscles. Below we higlight two different muscles on a neutral face:
muscles = {'temporalis_r_rel': "red", 'pars_palp_l': 'green'}
_ = plot_face(au=neutral, muscles=muscles)
Adding gaze vectors to the plot#
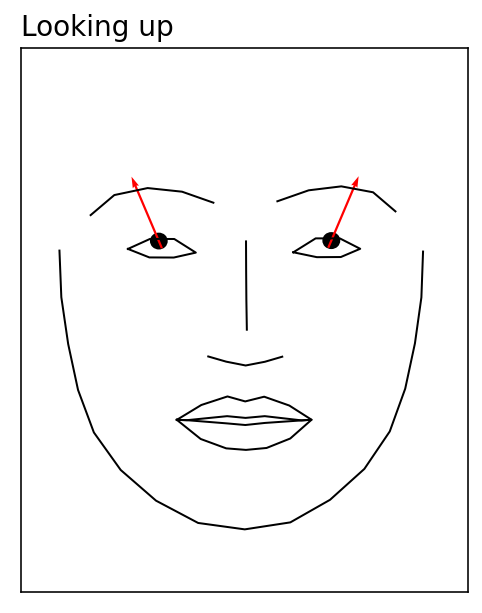
Py-Feat also supports overlaying gaze vectors to indicate where the eyes are looking. By default the eyes are always in a neutral position pointing forward. But it’s possible to pass an array to the gaze argument of plot_face() to move the eyes.
Gaze vectors are length 4 (lefteye_x, lefteye_y, righteye_x, righteye_y) where the y orientation is positive for looking upwards.
# Add some gaze vectors: (lefteye_x, lefteye_y, righteye_x, righteye_y)
gaze = [-1, 5, 1, 5]

_ = plot_face(au=neutral, gaze=gaze, title='Looking up')
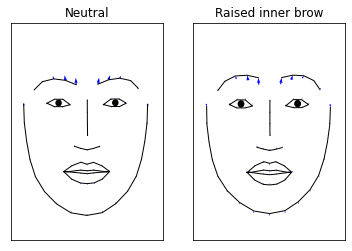
Adding vectorfield arrows to highlight facial movement#
One way we can highlight how a faces change between two expressions is by overlaying a vectorfield of arrows for each facial landmark pointing in the direction of movement from one face to another. To do so, we use the predict() function to get landmark data for each array of AU intensities we want to plot and generate a vectors dictionary with keys for the 'target' and 'reference' faces. Then we can pass this dictionary to the vectorfield argument of plot_face():
from feat.plotting import predict
import matplotlib.pyplot as plt

# Get landmarks
neutral_landmarks = predict(neutral)
raised_inner_brow_landmarks = predict(raised_inner_brow)

# Provide target landmarks and other vector specifications
netural_to_target = {
    "target": raised_inner_brow_landmarks,
    "reference": neutral_landmarks,
    "color": "blue",
}
target_to_neutral = {
    "target": raised_inner_brow_landmarks,
    "reference": neutral_landmarks,
    "color": "blue",
}

fig, axes = plt.subplots(1, 2)
# Vectorfield goes from neutral -> target on neutral face
_ = plot_face(ax=axes[0], au=neutral, title="Neutral", vectorfield=netural_to_target)
# Vectorfield goes target -> neutral on target face
_ = plot_face(
    ax=axes[1],
    au=raised_inner_brow,
    title="Raised inner brow",
    vectorfield=target_to_neutral,
)
4.3 Plotting with Fex data classes#
While you can always use the plot_face() function directly by passing in AU intensities, you can also use the .plot_aus() method on Fex data classes to visualize data. Just pass in numerical index i referring to the AU you want to visualize. That index corresponds to the ith column of the .au_columns attribute of the Fex data class instance.
Below we pass in 12 which corresponds to AU20:
from feat.utils import get_test_data_path
from feat.utils import read_openface
from os.path import join

test_file = join(get_test_data_path(),'OpenFace_Test.csv')
openface = read_openface(test_file)

# 12th AU in Openface model is AU 20
_ = openface.plot_aus(12, muscles={'all': "heatmap"})
4.4 Animating facial expressions#
Py-Feat includes an animate_face() function which makes it easy to “morph” one facial expression into another by interpolating between AU intensities. You can use this function in two ways:
Using the
AUkeyword argument and a single scalar value forstartandendPassing in 2 arrays of AU intensities for
startandend
The first style is mostly just a convenient way to visualize changes for a single AU. Below we use this style to animate raising of the inner brow:
from feat.plotting import animate_face

# Just pass in a FACS AU id, in this case we pass in 1 which is the inner brow raiser
animation = animate_face(
    AU=1, start=0, end=3, title="Raised inner brow", save="AU1.gif"
)
The second style is more flexible and behaves like plot_face(). It’s generally more useful when multiple AUs change together. Below we use this style to visualize 2 AUs changing with different intensities. We also overlay muscle activations which change dynamically in the animation:
# We reuse the AU arrays from above to morph between a neutral and smiling face
animation = animate_face(
    start=neutral,
    end=smiling,
    muscles={"all": "heatmap"},
    title='Smiling',
    save="smiling.gif",
)

It’s also possible to animate gaze directions using the gaze_start and gaze_end arguments to animate_face(). Here we pass the same neutral expression to start and end so the only thing being animates is gaze direction:
animation = animate_face(
    start=neutral,
    end=neutral,
    gaze_start = [0,0,0,0],
    gaze_end = [-1, 5, 1, 5],
    title='Looking Up',
    save='looking_up.gif'
)

More complex animations#
While animate_face() is useful for animating a single facial expression, sometimes you might want to make more complex multi-face animations. We can do that using plot_face() along with the interpolate_aus() helper function which will generate intermediate AU intensity values between two arrays in a manner that creates graceful animations (cubic bezier easing function).
We can easily make a grid of all 20 AUs and animate their intensity changes one at a time from a netural facial expression. To generate the animation from matplotlib plots, we use the celluloid library that makes it a bit easier to work with matplotlib animations. It’s also what animate_face uses under the hood:
from feat.utils import RF_AU_presence # AU ids
from feat.plotting import interpolate_aus # cubic easing interpolation
from celluloid import Camera

# Link AU ids to their descriptions; might be wrong? see:
au_name_map = list(
    zip(
        RF_AU_presence,
        [
            "inner brow raiser",
            "outer brow raiser",
            "brow lowerer",
            "upper lid raiser",
            "cheek raiser",
            "lid tightener",
            "nose wrinkler",
            "upper lip raiser",
            "lip corner puller",
            "dimpler",
            "lip corner depressor",
            "chin raiser",
            "lip puckerer",
            "lip stretcher",
            "lip tightener",
            "lip pressor",
            "lips part",
            "jaw drop",
            "lip suck",
            "eyes closed",
        ],
    )
)

# Start all AUs at neutral
starting_intensities = np.zeros((20, 20))

# And eventually get to 3
ending_intensities = np.eye(20) * 3

# Define some animation settings
fps = 15
duration = 0.5
padding = 0.25
num_frames = int(np.ceil(fps * duration))

# Add some padding frames so when the animation loops it pauses on the endpoints
num_padding_frames = int(np.ceil(fps * padding))
total_frames = (num_frames + num_padding_frames) * 2
# Loop over each frame of the animation, plot a 4 x 5 grid of faces
fig, axs = plt.subplots(4, 5, figsize=(12, 18))
camera = Camera(fig)

for frame_num in range(total_frames):
    for i, ax in enumerate(axs.flat):
        au_interpolations = interpolate_aus(
            start=starting_intensities[i, :],
            end=ending_intensities[i, :],
            num_frames=num_frames,
            num_padding_frames=num_padding_frames,
        )

        ax = plot_face(
            model=None,
            ax=ax,
            au=au_interpolations[frame_num],
            title=f"{au_name_map[i][0]}\n{au_name_map[i][1]}",
        )
    _ = camera.snap()

# Create the animation
animation = camera.animate()
animation.save("all.gif", fps=fps)