2. Detecting facial expressions from images#
Written by Jin Hyun Cheong and Eshin Jolly
In this tutorial we’ll explore the Detector class in more depth, demonstrating how to detect faces, facial landmarks, action units, and emotions from images. You can try it out interactively in Google Collab: ![]()
# Uncomment the line below and run this only if you're using Google Collab
# !pip install -q py-feat
2.1 Detecting a single face from a single image#
Setting up the Detector#
When using the Detector you can either specify specific models to use or just load the default models which are defined explicitly below:
from feat import Detector

detector = Detector(
    face_model="retinaface",
    landmark_model="mobilefacenet",
    au_model='xgb',
    emotion_model="resmasknet",
    facepose_model="img2pose",
)

detector
feat.detector.Detector(face_model=retinaface, landmark_model=mobilefacenet, au_model=xgb, emotion_model=resmasknet, facepose_model=img2pose, identity_model=facenet)
Let’s process a single image with a single face. Py-feat includes a demo image for this purpose called single_face.jpg so lets use that. You can also use the convenient imshow function which will automatically load an image into a numpy array if provided a path unlike matplotlib:
from feat.utils.io import get_test_data_path
from feat.plotting import imshow
import os

# Helper to point to the test data folder
test_data_dir = get_test_data_path()

# Get the full path
single_face_img_path = os.path.join(test_data_dir, "single_face.jpg")

# Plot it
imshow(single_face_img_path)

Now we use our initialized detector instance to make predictions with the detect_image() method. This is the main workhorse method that will perform face, landmark, au, and emotion detection using the loaded models. It always returns a Fex data instance:
single_face_prediction = detector.detect_image(single_face_img_path)

# Show results
single_face_prediction
100%|██████████| 1/1 [00:01<00:00, 1.05s/it]
| FaceRectX | FaceRectY | FaceRectWidth | FaceRectHeight | FaceScore | x_0 | x_1 | x_2 | x_3 | x_4 | ... | Identity_505 | Identity_506 | Identity_507 | Identity_508 | Identity_509 | Identity_510 | Identity_511 | Identity_512 | input | frame | |
|---|---|---|---|---|---|---|---|---|---|---|---|---|---|---|---|---|---|---|---|---|---|
| 0 | 192.507763 | 140.455324 | 179.3527 | 259.257753 | 0.999708 | 187.430438 | 188.301049 | 190.15731 | 194.596453 | 203.539803 | ... | -0.005776 | -0.035352 | -0.001157 | 0.001913 | 0.117051 | -0.001347 | -0.012121 | 0.029357 | /Users/esh/Documents/pypackages/py-feat/feat/t... | 0 |
1 rows × 686 columns
Working with Fex data class results#
Because the output is a Fex data class instance, we can utilize its various helper methods and attributes to inspect our predictions.
Easily accessing FEX columns of interest.#
Fex data classes make it simple to access various columns of interest (AUs, emotion, faceboxes, etc):
single_face_prediction.faceboxes
| FaceRectX | FaceRectY | FaceRectWidth | FaceRectHeight | FaceScore | |
|---|---|---|---|---|---|
| 0 | 192.507763 | 140.455324 | 179.3527 | 259.257753 | 0.999708 |
single_face_prediction.aus
| AU01 | AU02 | AU04 | AU05 | AU06 | AU07 | AU09 | AU10 | AU11 | AU12 | AU14 | AU15 | AU17 | AU20 | AU23 | AU24 | AU25 | AU26 | AU28 | AU43 | |
|---|---|---|---|---|---|---|---|---|---|---|---|---|---|---|---|---|---|---|---|---|
| 0 | 0.607853 | 0.293292 | 0.054883 | 0.285801 | 0.917875 | 1.0 | 0.356386 | 0.636989 | 1.0 | 0.953904 | 0.722208 | 0.073059 | 0.154148 | 1.0 | 0.155187 | 0.015028 | 0.999779 | 0.888506 | 0.033452 | 0.116028 |
single_face_prediction.emotions
| anger | disgust | fear | happiness | sadness | surprise | neutral | |
|---|---|---|---|---|---|---|---|
| 0 | 0.00051 | 0.000026 | 0.002214 | 0.991036 | 0.000028 | 0.006158 | 0.000029 |
single_face_prediction.poses # (in degrees)
| Pitch | Roll | Yaw | |
|---|---|---|---|
| 0 | 0.811819 | -3.737926 | 6.101121 |
Saving detection to a file#
Since a Fex object is just a sub-classed DataFrames we can use the .to_csv method to save our detections toa file:
single_face_prediction.to_csv("output.csv", index=False)
Loading detection results from a saved file#
We can load this output using the read_feat() function, which behaves just like pd.read_csv from Pandas, but returns a Fex data class instead of a DataFrame. This gives you the full suite of Fex funcionality right away.
# prefer to pandas read_csv
from feat.utils.io import read_feat

input_prediction = read_feat("output.csv")

# Show results
input_prediction
| FaceRectX | FaceRectY | FaceRectWidth | FaceRectHeight | FaceScore | x_0 | x_1 | x_2 | x_3 | x_4 | ... | AU43 | anger | disgust | fear | happiness | sadness | surprise | neutral | input | frame | |
|---|---|---|---|---|---|---|---|---|---|---|---|---|---|---|---|---|---|---|---|---|---|
| 0 | 192.561653 | 140.51021 | 179.37261 | 259.209973 | 0.999708 | 186.658539 | 187.411811 | 189.165036 | 193.472231 | 202.410419 | ... | 0.277524 | 0.000495 | 0.000025 | 0.001946 | 0.990421 | 0.000028 | 0.007057 | 0.000029 | output.csv | 0 |
1 rows × 173 columns
Visualizing detection results.#
We can use the .plot_detections() method to generate a summary figure of detected faces, action units and emotions. It always returns a list of matplotlib figures:
figs = single_face_prediction.plot_detections(poses=True)
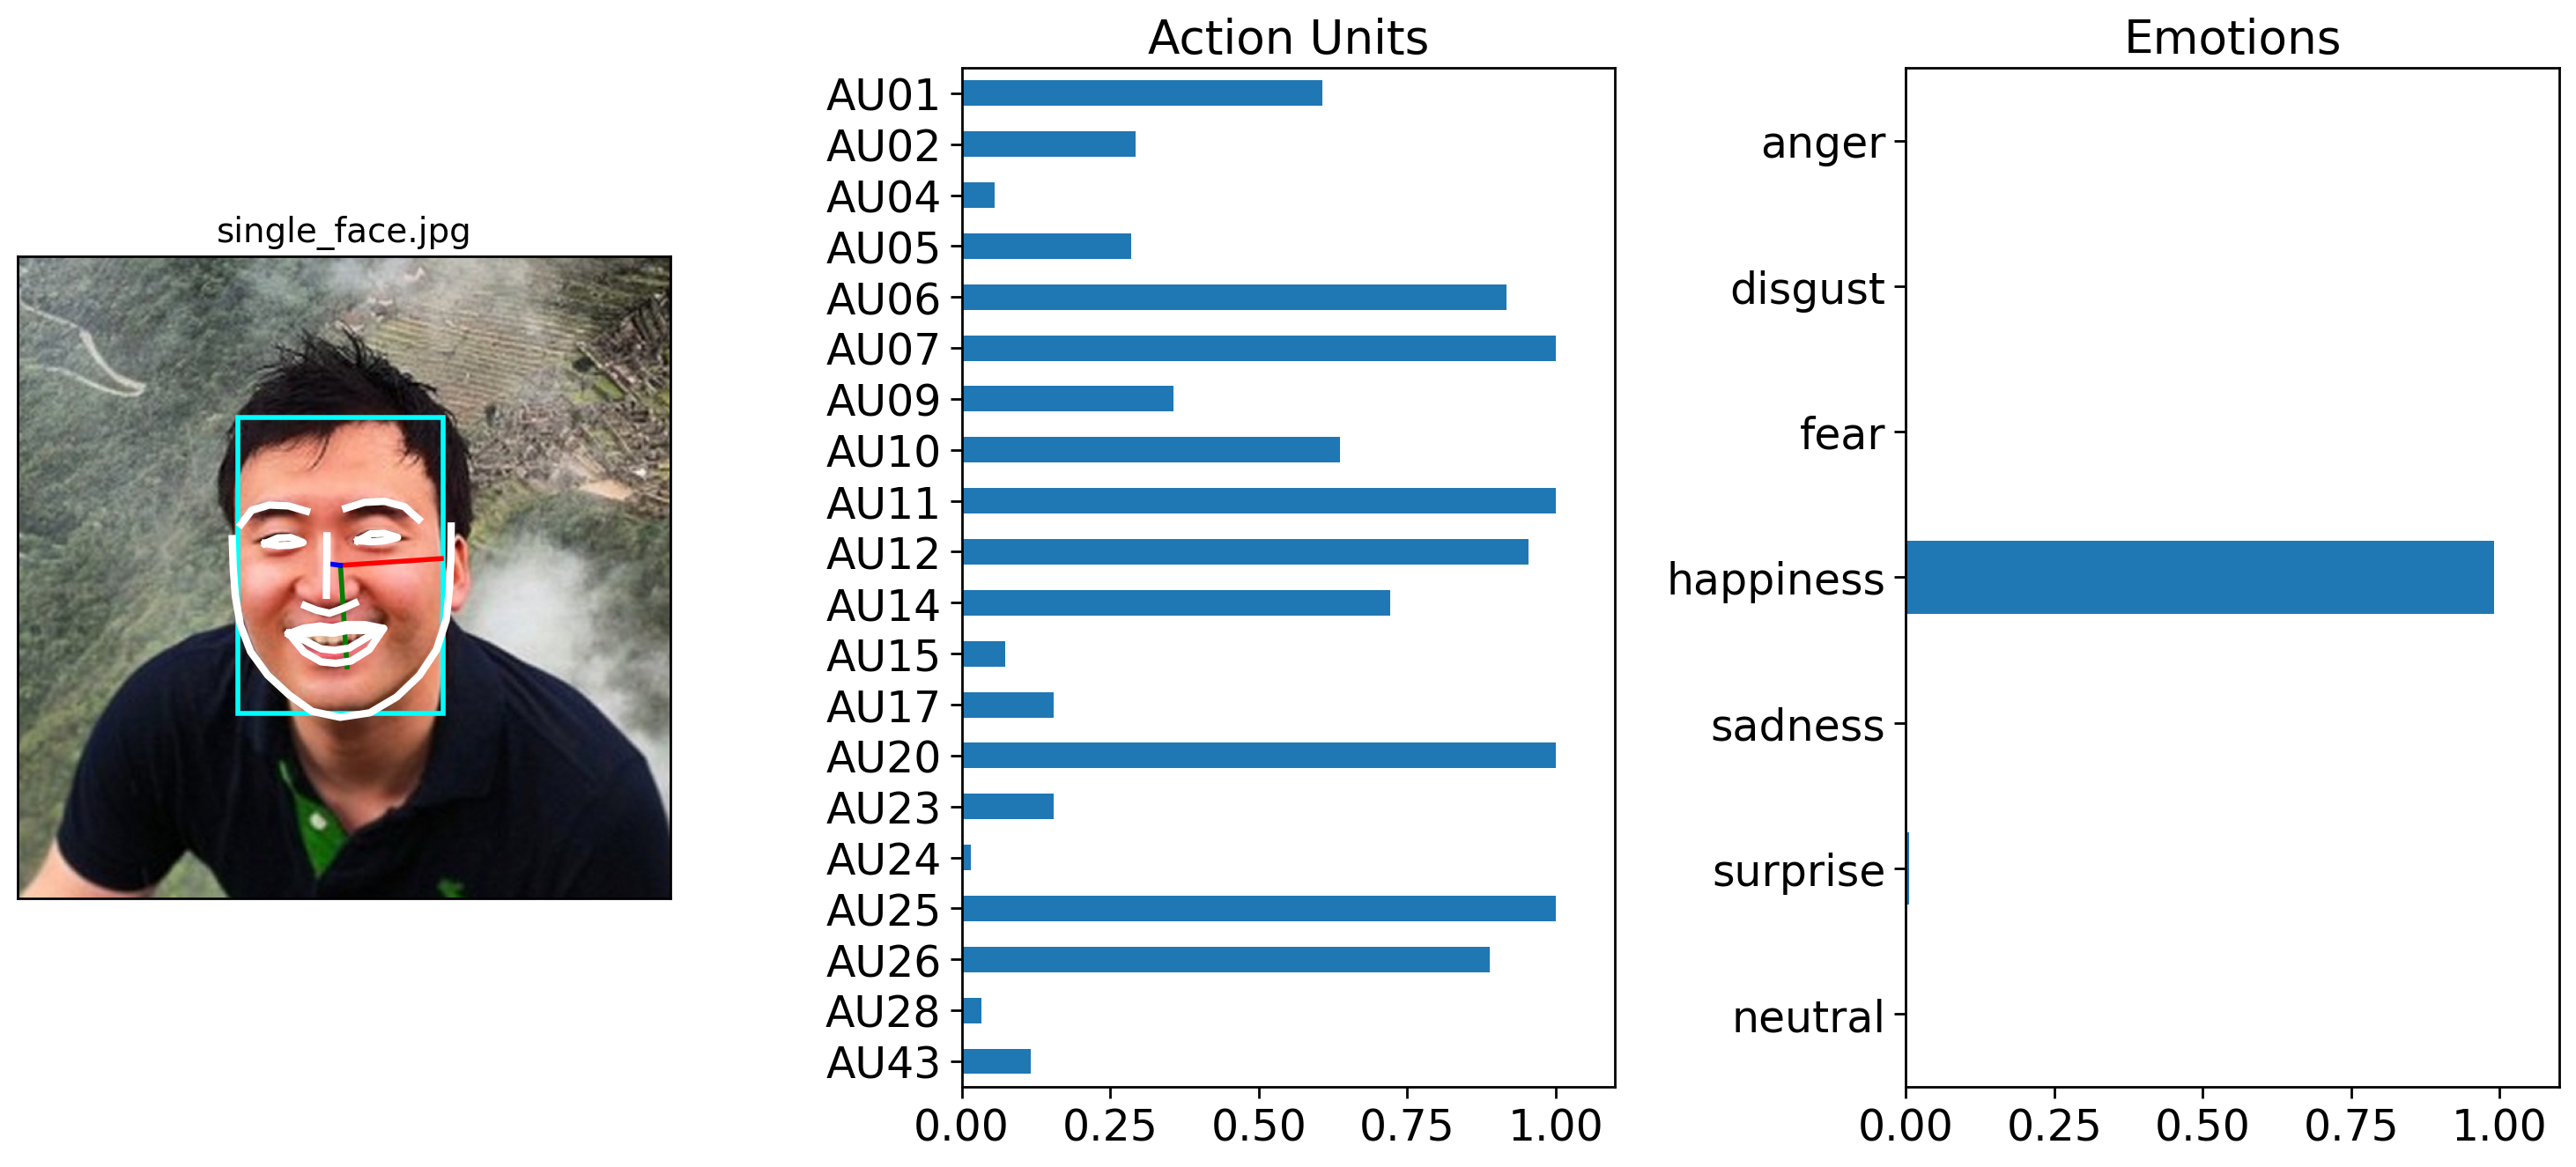
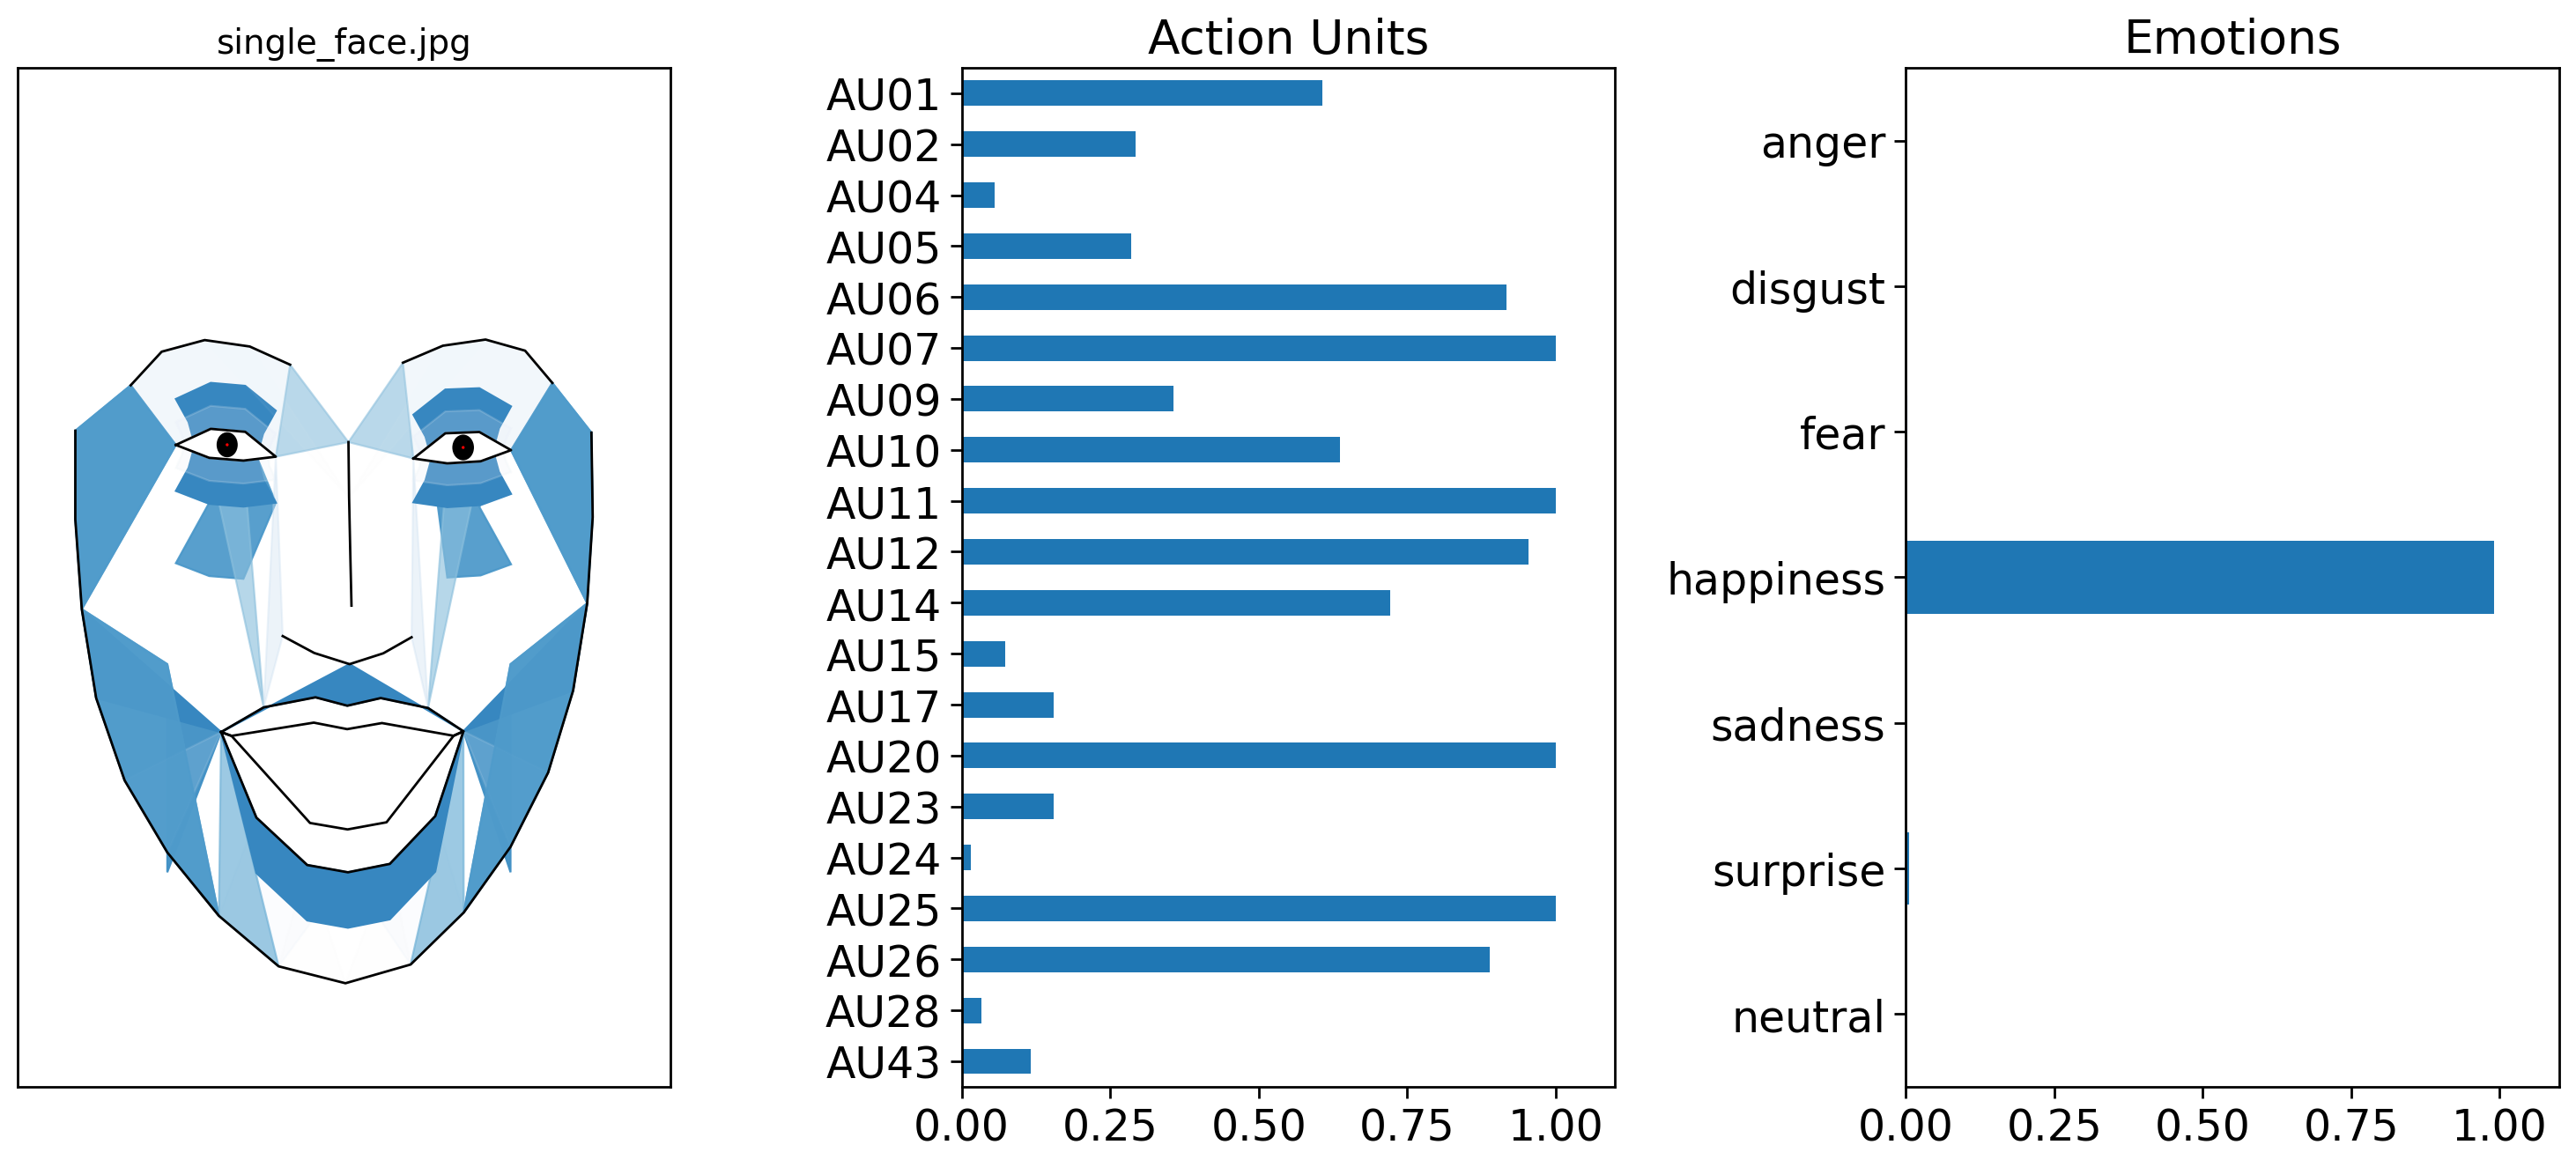
By default .plot_detections() will overlay facial lines on top of the input image. However, it’s also possible to visualize a face using Py-Feat’s standardized AU landmark model, which takes the detected AUs and projects them onto a template face. You an control this by change by setting faces='aus' instead of the default faces='landmarks'. For more details about this kind of visualization see the visualizing facial expressions and the creating an AU visualization model tutorials:
figs = single_face_prediction.plot_detections(faces='aus', muscles=True)
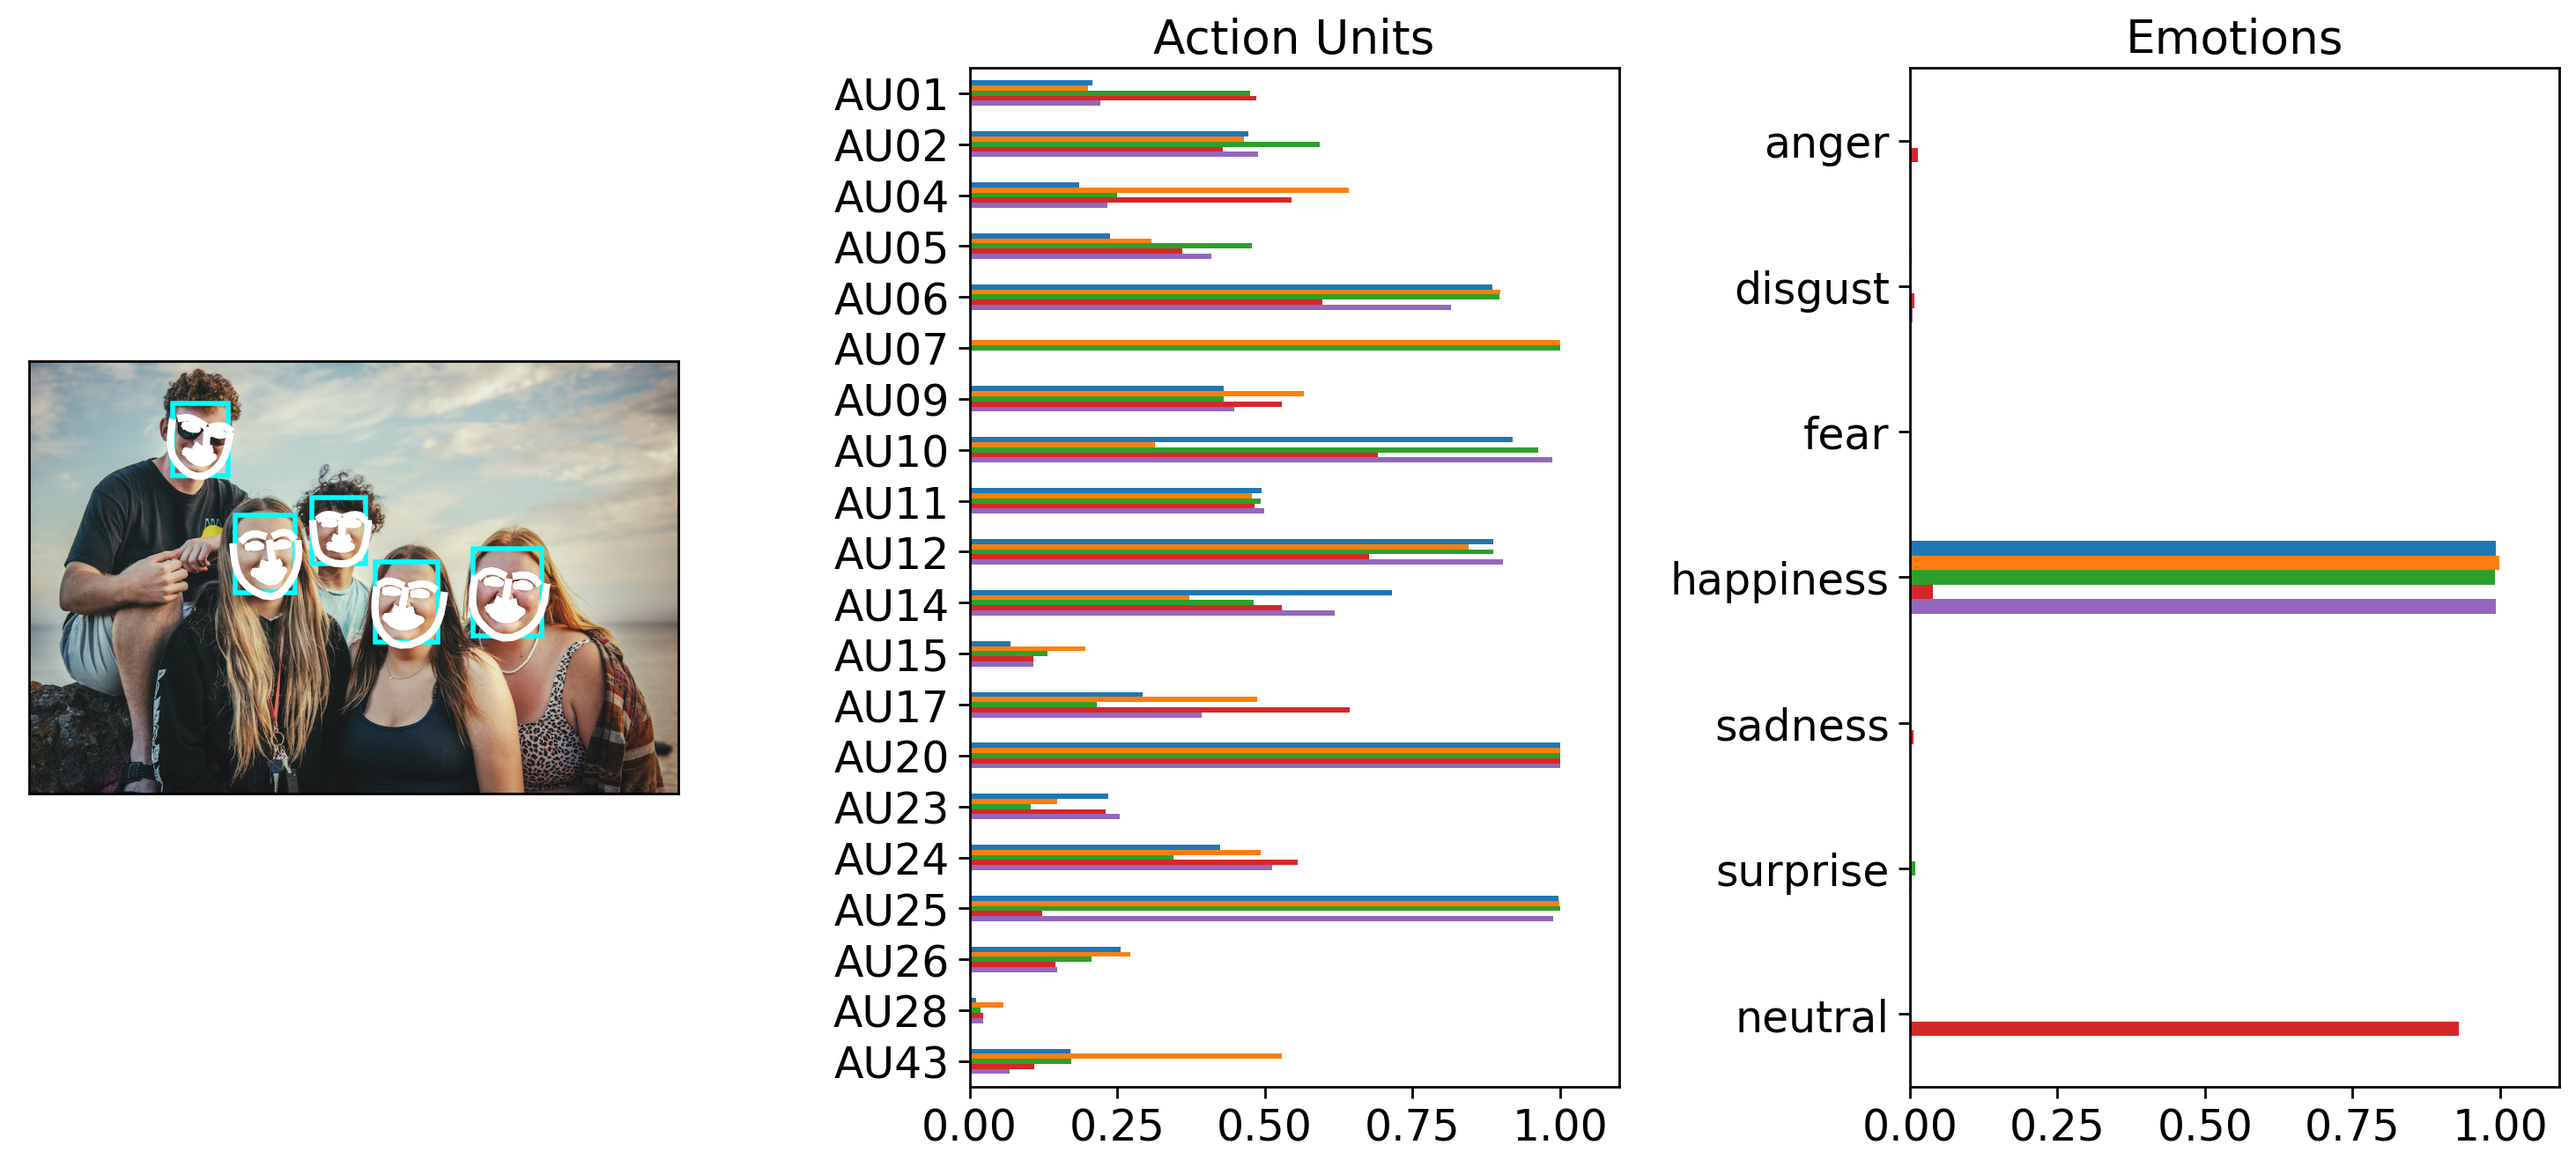
2.2 Detecting multiple faces from a single image#
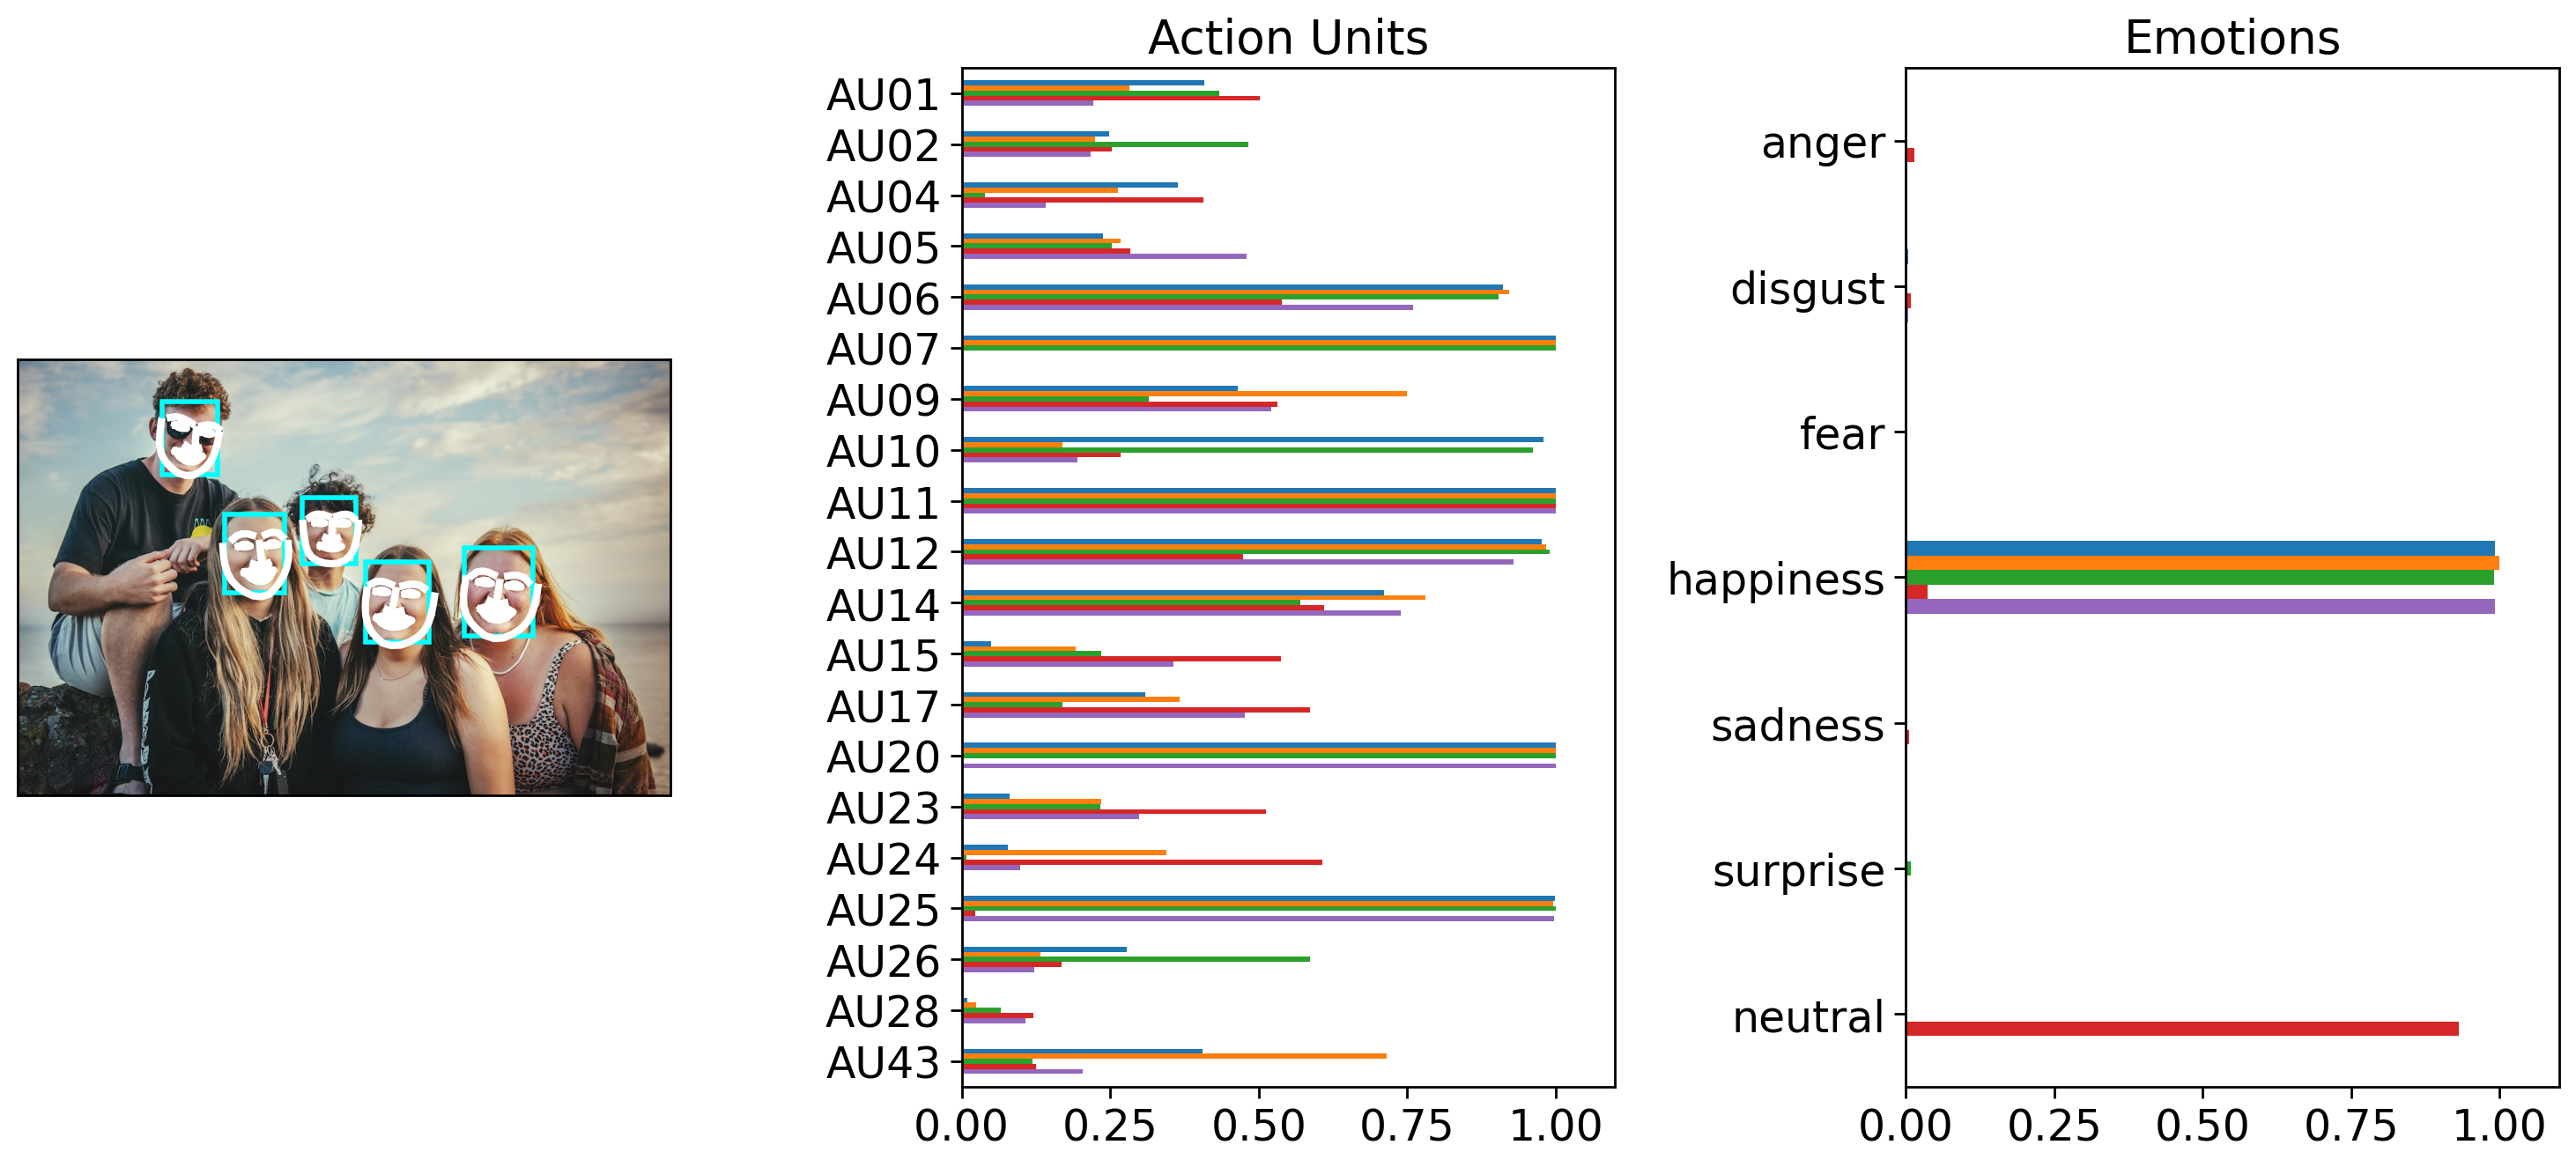
A Detector can automatically find multiple faces in a single image. We’ll see that in the next example, the number of rows of the Fex data class returned from .detect_image() has one row for each detected face. We’ll also try using a different model this time, Img2Pose, which acts as both a face detector and a face pose estimator.
Notice how image_prediction is now a Fex instance with 5 rows, one for each detected face. We can confirm this by plotting our detection results and poses like before:
multi_face_image_path = os.path.join(test_data_dir, "multi_face.jpg")
multi_face_prediction = detector.detect_image(multi_face_image_path)

# Show results
multi_face_prediction
0%| | 0/1 [00:00<?, ?it/s]
100%|██████████| 1/1 [00:01<00:00, 1.93s/it]
| FaceRectX | FaceRectY | FaceRectWidth | FaceRectHeight | FaceScore | x_0 | x_1 | x_2 | x_3 | x_4 | ... | Identity_505 | Identity_506 | Identity_507 | Identity_508 | Identity_509 | Identity_510 | Identity_511 | Identity_512 | input | frame | |
|---|---|---|---|---|---|---|---|---|---|---|---|---|---|---|---|---|---|---|---|---|---|
| 0 | 683.340962 | 288.568895 | 105.420755 | 134.124931 | 0.999817 | 685.511870 | 683.331586 | 682.070848 | 682.695525 | 686.402923 | ... | 0.033936 | -0.041451 | -0.010431 | -0.050652 | 0.057576 | -0.016750 | 0.052456 | 0.071331 | /Users/esh/Documents/pypackages/py-feat/feat/t... | 0 |
| 1 | 531.699620 | 309.095124 | 97.330348 | 123.796507 | 0.999361 | 534.246679 | 532.407478 | 531.774721 | 532.450397 | 535.062077 | ... | 0.074216 | -0.008548 | -0.043167 | 0.008296 | 0.081963 | -0.031615 | 0.053231 | 0.031800 | /Users/esh/Documents/pypackages/py-feat/feat/t... | 0 |
| 2 | 316.664986 | 236.808266 | 91.607044 | 120.287714 | 0.998966 | 313.592762 | 314.633883 | 316.859567 | 320.841335 | 327.401511 | ... | 0.037859 | -0.039686 | -0.053666 | -0.062578 | -0.022025 | -0.039633 | -0.027346 | 0.017940 | /Users/esh/Documents/pypackages/py-feat/feat/t... | 0 |
| 3 | 435.052554 | 211.107515 | 81.976803 | 101.041442 | 0.994319 | 436.121349 | 436.979648 | 438.452164 | 440.423172 | 443.637487 | ... | 0.028489 | -0.064772 | -0.014781 | -0.011815 | 0.037212 | 0.053282 | 0.051709 | 0.041597 | /Users/esh/Documents/pypackages/py-feat/feat/t... | 0 |
| 4 | 220.073854 | 64.653705 | 85.268424 | 110.928977 | 0.994262 | 219.496109 | 217.772578 | 216.813998 | 217.033585 | 219.753727 | ... | 0.042779 | 0.054387 | 0.000781 | 0.039160 | 0.068925 | -0.011794 | 0.028254 | -0.062116 | /Users/esh/Documents/pypackages/py-feat/feat/t... | 0 |
5 rows × 686 columns
figs = multi_face_prediction.plot_detections(add_titles=False)
2.3 Detecting faces from multiple images#
Detector is also flexible enough to process multiple image files if .detect_image() is passed a list of images. By default images will be processed serially, but you can set batch_size > 1 to process multiple images in a batch and speed up processing. NOTE: All images in a batch must have the same dimensions for batch processing. This is because behind the scenes, Detector is assembling a tensor by stacking images together. You can ask Detector to rescale images by padding and preserving proportions using the output_size in conjunction with batch_size. For example, the following would process a list of images in batches of 5 images at a time resizing each so one axis is 512:
detector.detect_image(img_list, batch_size=5, output_size=512) # without output_size this would raise an error if image sizes differ!
In the example below we keep things simple, by process both our single and multi-face example serislly by setting batch_size = 1.
Notice how the returned Fex data class instance has 6 rows: 1 for the first face in the first image, and 5 for the faces in the second image:
NOTE: Currently batch processing images gives slightly different AU detection results due to the way that py-feat integrates the underlying models. You can examine the degree of tolerance by checking out the results of test_detection_and_batching_with_diff_img_sizes in our test-suite
img_list = [single_face_img_path, multi_face_image_path]

mixed_prediction = detector.detect_image(img_list, batch_size=1)
mixed_prediction
0%| | 0/2 [00:00<?, ?it/s]
100%|██████████| 2/2 [00:02<00:00, 1.45s/it]
| FaceRectX | FaceRectY | FaceRectWidth | FaceRectHeight | FaceScore | x_0 | x_1 | x_2 | x_3 | x_4 | ... | Identity_505 | Identity_506 | Identity_507 | Identity_508 | Identity_509 | Identity_510 | Identity_511 | Identity_512 | input | frame | |
|---|---|---|---|---|---|---|---|---|---|---|---|---|---|---|---|---|---|---|---|---|---|
| 0 | 192.507763 | 140.455324 | 179.352700 | 259.257753 | 0.999708 | 187.430438 | 188.301049 | 190.157310 | 194.596453 | 203.539803 | ... | -0.005776 | -0.035352 | -0.001157 | 0.001913 | 0.117051 | -0.001347 | -0.012121 | 0.029357 | /Users/esh/Documents/pypackages/py-feat/feat/t... | 0 |
| 1 | 683.340962 | 288.568895 | 105.420755 | 134.124931 | 0.999817 | 685.511870 | 683.331586 | 682.070848 | 682.695525 | 686.402923 | ... | 0.033936 | -0.041451 | -0.010431 | -0.050652 | 0.057576 | -0.016750 | 0.052456 | 0.071331 | /Users/esh/Documents/pypackages/py-feat/feat/t... | 1 |
| 2 | 531.699620 | 309.095124 | 97.330348 | 123.796507 | 0.999361 | 534.246679 | 532.407478 | 531.774721 | 532.450397 | 535.062077 | ... | 0.074216 | -0.008548 | -0.043167 | 0.008296 | 0.081963 | -0.031615 | 0.053231 | 0.031800 | /Users/esh/Documents/pypackages/py-feat/feat/t... | 1 |
| 3 | 316.664986 | 236.808266 | 91.607044 | 120.287714 | 0.998966 | 313.592762 | 314.633883 | 316.859567 | 320.841335 | 327.401511 | ... | 0.037859 | -0.039686 | -0.053666 | -0.062578 | -0.022025 | -0.039633 | -0.027346 | 0.017940 | /Users/esh/Documents/pypackages/py-feat/feat/t... | 1 |
| 4 | 435.052554 | 211.107515 | 81.976803 | 101.041442 | 0.994319 | 436.121349 | 436.979648 | 438.452164 | 440.423172 | 443.637487 | ... | 0.028489 | -0.064772 | -0.014781 | -0.011815 | 0.037212 | 0.053282 | 0.051709 | 0.041597 | /Users/esh/Documents/pypackages/py-feat/feat/t... | 1 |
| 5 | 220.073854 | 64.653705 | 85.268424 | 110.928977 | 0.994262 | 219.496109 | 217.772578 | 216.813998 | 217.033585 | 219.753727 | ... | 0.042779 | 0.054387 | 0.000781 | 0.039160 | 0.068925 | -0.011794 | 0.028254 | -0.062116 | /Users/esh/Documents/pypackages/py-feat/feat/t... | 1 |
6 rows × 686 columns
Calling .plot_detections() will now plot detections for all images the detector was passed:
figs = mixed_prediction.plot_detections(add_titles=False)
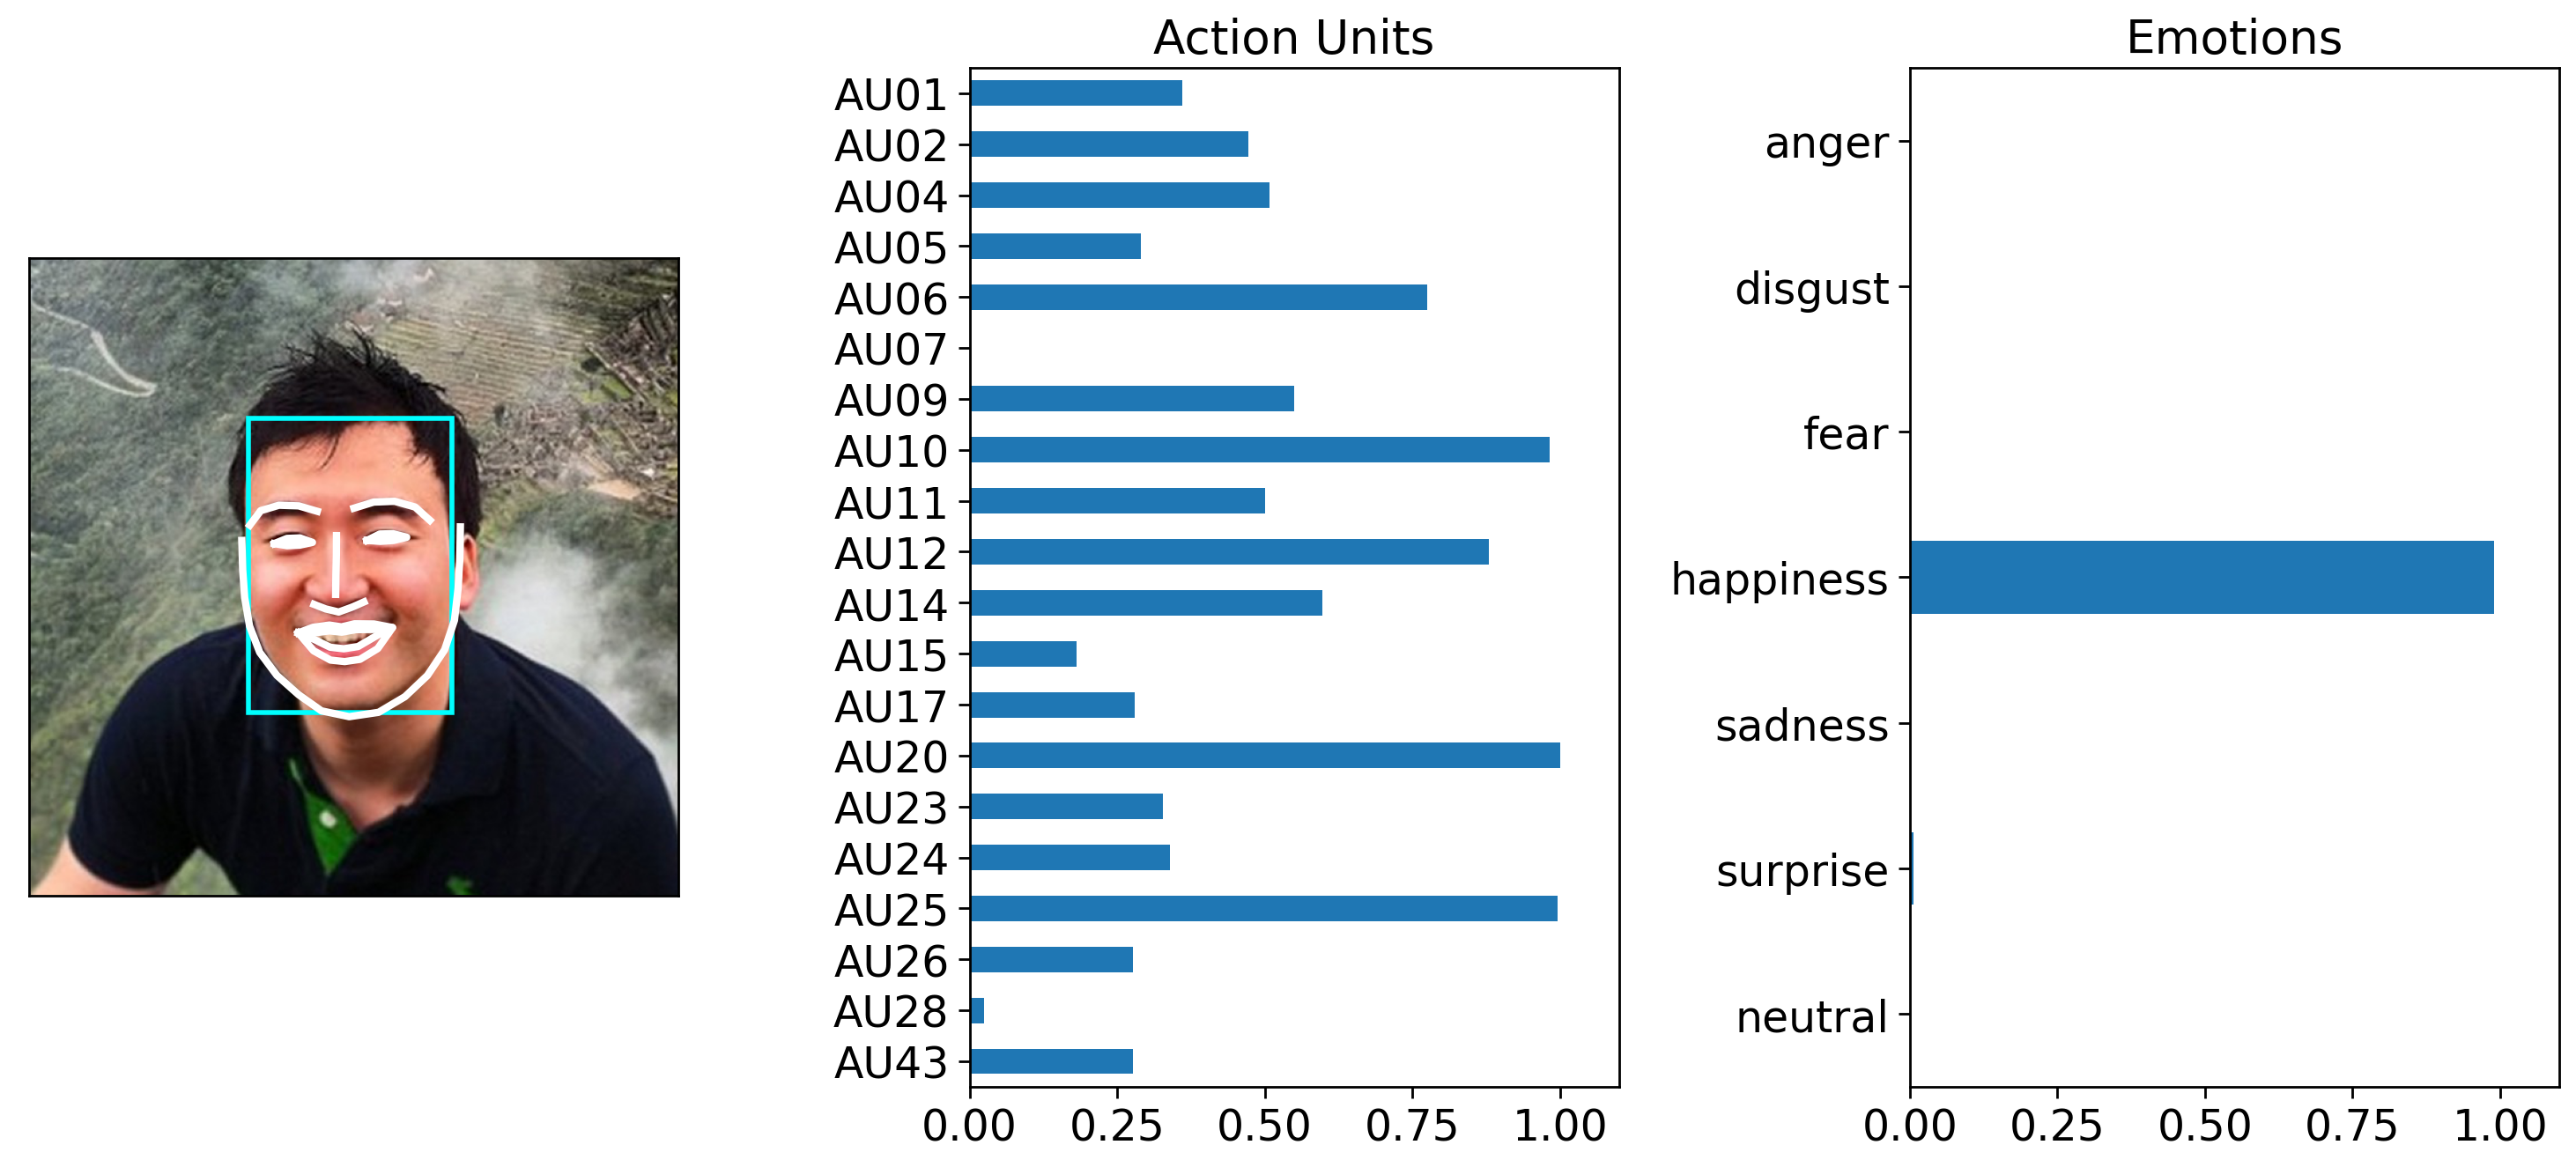
However, it’s easy to use pandas slicing sytax to just grab predictions for the image you want. For example you can use .loc and chain it to .plot_detections():
# Just plot the detection corresponding to the first row in the Fex data
figs = mixed_prediction.loc[0].plot_detections(add_titles=False)
Likewise you can use .query() and chain it to .plot_detections(). Fex data classes store each file path in the 'input' column. So we can use regular pandas methods like .unique() to get all the unique images (2 in our case) and pick the second one.
# Choose plot based on image file name
img_name = mixed_prediction['input'].unique()[1]
axes = mixed_prediction.query("input == @img_name").plot_detections(add_titles=False)